INITWIN · Editorial
Software & digital strategy
Automating financial reports: from manual Excel to a real-time updated dashboard
How to escape repetitive reporting with Python, SQL and a financial dashboard connected to company data
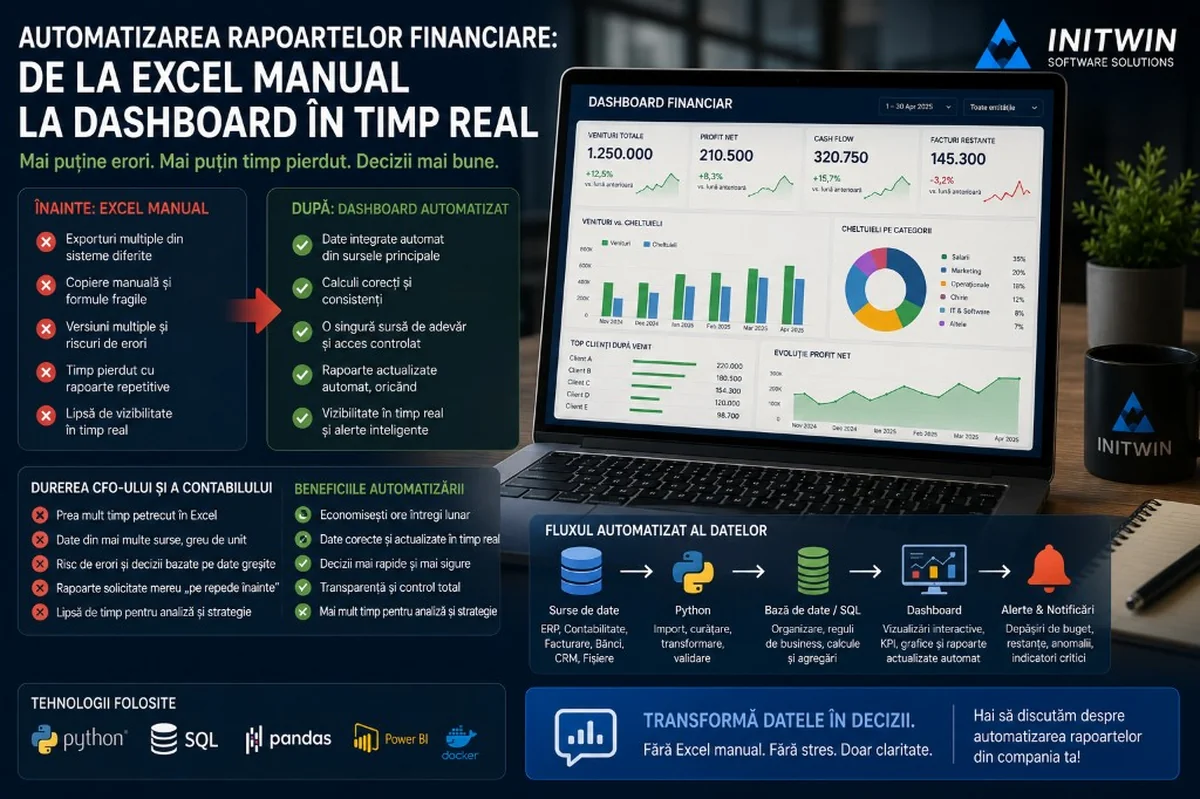
How to escape repetitive reporting with Python, SQL and a financial dashboard connected to company data.
In many companies, financial reporting still depends on Excel. Not because Excel is not useful, but because it has become the default solution for every problem: export from ERP, export from invoicing software, export from the bank, export from CRM, a few formulas, a few pivot tables, manual checks, email to management and the same process repeated the following week.
For the CFO, accountant, controller or financial manager, this routine consumes time and energy. Worse, it creates risk. A wrong formula, an old file, a moved column, an incomplete export or a wrong version sent can change the conclusions of a report.
At the beginning, manual reporting seems acceptable. When the company is small, there are few invoices, few accounts, few cost centres and a few simple reports. But as the business grows, Excel becomes a parallel financial system that is hard to control.
This is where financial report automation comes in. Automation does not mean giving up Excel completely. It means no longer depending on repetitive manual work for reports that can be generated automatically from real data in the company's systems.
A modern flow can use Python for processing, SQL for querying and organising data, a central database for consolidation and a dashboard for visualisation. The result is simple: financial reports updated automatically, available anytime, with fewer errors and more confidence in data.
The real pain: manual financial reporting
In many companies, financial reporting looks something like this:
- accounting exports data from the accounting software;
- sales sends a separate Excel file;
- operations sends another file;
- invoices are exported from the ERP;
- collections are checked in the bank;
- expenses are grouped manually;
- the CFO or accountant combines everything;
- formulas are checked;
- pivot tables are built;
- versions are saved;
- the report is sent by email.
This process can take hours or days, depending on complexity. And if management asks for a change, the report must be rebuilt.
"Can you also show it by cost centre?" "Can you separate recurring revenue from one-time revenue?" "Can you compare this month with the same month last year?" "Can you see which clients are late on payment?" "Can you show me margin by project?"
Each question means a new export, a new formula, a new check.
The problem is not that people do not know how to work. The problem is that the process is built on manual work.
Why Excel is not enough for recurring financial reporting
Excel is a very good tool. It is flexible, fast and known by almost all finance professionals. The problem appears when Excel becomes the main base for recurring operational reporting.
Excel is excellent for ad-hoc analysis. But it is risky as a permanent financial reporting system if:
- data is copied manually;
- there are multiple versions of the same file;
- formulas are not audited;
- files are sent by email;
- there is no access control;
- there are no logs;
- there is no automatic update;
- data comes from multiple sources;
- the report must be rebuilt frequently.
An important financial report should not depend on the question "which is the latest version of the file?"
When business decisions are made based on reporting, the company needs a more stable source of truth.
What financial report automation means
Financial report automation means connecting data sources, processing information and displaying indicators in a dashboard or report updated automatically.
Instead of a person exporting and combining data manually, the system does this in a controlled way.
An automatic flow can look like this:
- data is extracted from ERP, accounting, invoicing, CRM, bank or files;
- data is cleaned and transformed;
- data is saved in a central database;
- financial rules are applied automatically;
- indicators are calculated;
- the dashboard is updated daily, every few hours or almost in real time;
- management sees data without requesting manual reports.
For the CFO, the advantage is major: less time lost preparing the report and more time for interpreting data.
The role of SQL in financial reporting
SQL is the language used for querying databases. In a financial reporting system, SQL helps extract, filter, aggregate and calculate data.
For example, with SQL you can quickly obtain: revenue by month, expenses by category, gross profit, invoices issued, invoices collected, overdue invoices, revenue by client, margin by project, costs by department, operating cash flow, balances by period, comparative evolution versus last year.
The advantage of SQL is that rules become explicit and repeatable. Instead of each report having its own formulas in Excel, logic can be centralised in queries and reporting tables.
If you want "monthly revenue" to be calculated the same way every time, SQL helps with standardisation.
The role of Python in automation
Python is very useful for data processing and automation. It can take files, clean data, call APIs, transform complex structures and send results to a database or dashboard.
In a financial reporting project, Python can be used for:
- automatic import from Excel or CSV;
- connecting to APIs;
- processing data from ERP;
- data validation;
- cleaning names;
- standardising categories;
- calculating indicators;
- detecting anomalies;
- generating PDF reports;
- sending email alerts;
- updating dashboards.
For example, if an ERP exports invoices in a difficult format, Python can transform that file into a clean structure. If the bank provides statements in a standard format, Python can take transactions and match them with invoices. If there are costs by department, Python can apply allocation rules.
Python is very good where the process is too complex for Excel formulas but does not justify repetitive manual work.
The dashboard: where numbers become decisions
A financial dashboard is not just a collection of charts. It is a management tool.
A good dashboard must quickly answer important questions:
- How much did we sell this month?
- What is gross profit?
- What are the main expenses?
- Which clients have overdue invoices?
- What does cash flow look like?
- Which projects are profitable?
- Which departments exceed budget?
- What is the trend versus last month?
- Where do anomalies appear?
For management, the dashboard offers visibility. For the CFO, it offers control. For accounting, it reduces pressure from repetitive reports.
A good dashboard does not need to be overloaded. Ten relevant indicators are better than 50 charts that do not lead to decisions.
Which financial indicators are worth automating
Not all reports need to be automated on day one. It is best to start with indicators that are requested frequently and consume the most time.
Examples of useful financial KPIs:
- monthly revenue;
- monthly expenses;
- gross profit;
- estimated net profit;
- estimated EBITDA;
- cash flow;
- invoices issued;
- overdue invoices;
- average days to collect;
- revenue by client;
- revenue by product;
- revenue by department;
- costs by cost centre;
- margin by project;
- budget versus actual;
- monthly trend;
- top clients;
- top expenses;
- alerts for budget overruns.
For a services company, margin by project may be essential. For retail, stock and margin by category may matter more. For distribution, client balances and cash flow are critical. For SaaS, recurring revenue and churn are important indicators.
Automation must be adapted to the business model.
Data: the hard part the dashboard hides
A dashboard looks simple at the end, but the hard part is behind it: data.
Financial data can come from many sources: ERP, accounting software, invoicing software, bank, CRM, online store, payment platform, Excel files, time tracking systems, project applications, payroll systems, e-Factura, SAF-T, external APIs.
Each source has its own format. Some data is clean. Others have different names, missing codes, incomplete fields, duplicates or errors.
That is why financial reporting automation does not start with the dashboard. It starts with inventory of data sources.
We need to know where data comes from, how often it is updated, who validates it and what rules apply.
Source of truth: who is right?
In a company, the same figure can appear differently in multiple systems.
Sales says revenue is X. Accounting says revenue is Y. The ERP shows another value. The online store dashboard shows something else.
This does not necessarily mean someone is wrong. Each system may use a different definition: orders placed, orders paid, invoices issued, invoices collected, revenue without VAT, revenue with VAT, accounting-recognised revenue, operational revenue.
Before automation, concepts must be defined.
What does "monthly sales" mean? What does "revenue" mean? What does "active client" mean? What does "overdue invoice" mean? What does "margin" mean?
Without these definitions, the dashboard can look good but generate endless discussions.
From monthly report to daily updated dashboard
An important benefit of automation is frequency.
In manual reporting, many companies see correct figures only at month end. Sometimes even later. Until then, decisions are made on estimates.
With an automatic dashboard, data can be updated daily, every few hours or in real time, depending on sources.
For management, this completely changes the way of working.
You no longer find out at month end that an important client is late on payment. You see it sooner.
You no longer find out too late that a department exceeded budget. You get an alert.
You no longer wait for the weekly report for sales evolution. You have the dashboard available.
This visibility helps the company react faster.
Automation does not replace the CFO or accountant
A frequent fear is that automation "replaces people". In reality, in financial reporting, automation replaces repetitive work, not professional judgement.
A good CFO should not spend hours copying data between files. They should interpret figures, explain risks, support decisions and anticipate problems.
An accountant should not manually rebuild the same report every month. They should validate correctness, track exceptions and ensure compliance.
Automation shifts attention from preparing data to analysing it.
This is the real value.
Concrete examples of financial automation
1. Overdue invoices
Instead of someone exporting invoices monthly and manually filtering overdue items, the system can automatically display: due invoices, overdue invoices, days late, outstanding amount, client, responsible agent, collection history.
Automatic alerts can be sent to the sales team or the client owner.
2. Budget versus actual
The company can upload the approved budget and the dashboard automatically compares actual expenses with budget. The manager quickly sees: departments over budget, categories with overruns, monthly trend, percentage differences, areas that need explanation.
3. Operating cash flow
A cash flow dashboard can combine invoices issued, due dates, collections, planned payments and balances. It does not replace detailed financial analysis, but offers a quick view of liquidity.
4. Margin by project
For services, construction, consulting or software companies, margin by project is essential. The system can combine invoiced revenue with direct costs, time worked, subcontractors and other expenses.
5. Management reports
Instead of the CFO manually preparing the monthly package, the dashboard can automatically generate a version for management: revenue, expenses, profit, cash, overdue amounts, top risks, explanations by indicator. The CFO can add interpretation, not rebuild all calculations.
Simplified technical architecture
An automated financial reporting system can have a relatively clear architecture.
- Data sources are connected through APIs, automatic exports or database access.
- Python takes data, cleans it and transforms it.
- SQL organises data in reporting tables.
- The dashboard connects to the database and displays indicators.
- A scheduler automatically runs the process at set intervals.
- The system sends alerts if errors or unusual values appear.
This architecture can be simple at the start and extended later. You do not need to build a complex data warehouse on day one. For many SMEs, a well-designed system with a few important sources and clear indicators can deliver value quickly.
Control, security and access
Financial reports contain sensitive data. Not every user should see everything.
A financial dashboard must have clear access rules: management sees the full picture, department managers see only their area, accounting sees relevant operational data, the sales team can see their own clients' overdue amounts, external users have no access.
Connection data for ERP, databases and APIs must also be protected. It is not acceptable for passwords or tokens to be stored in unsecured files.
For financial applications, audit is important. Who accessed the dashboard? Who exported data? Who changed rules? Who uploaded the budget?
Automation must bring efficiency, but also control.
Phased implementation
- Choose 5–10 reports or indicators that are requested frequently.
- Identify data sources.
- Define formulas and business rules.
- Build a first data pipeline.
- Create the initial dashboard.
- Test with real data.
- Automate updates.
- Add alerts, exports and new indicators.
This approach reduces risk. You do not try to automate the entire finance department in the first month. You start with the most painful area and expand gradually.
How much does financial report automation cost?
Cost depends on data sources, indicator complexity, data quality, security level and dashboard type.
A simple project, with import from a few Excel files and a basic dashboard, can start from a few thousand euros.
A medium project, with ERP connection, databases, transformation rules, dashboards and automatic updates, can reach €8,000–20,000.
A complex project, with data warehouse, multiple integrated systems, roles, audit, alerts, advanced reports and maintenance, can exceed €25,000–50,000.
Licensing costs for BI tools, hosting, maintenance and support can be added to these.
Importantly, the investment can be justified through time saved, reduced errors and faster decisions.
What the CFO gains
For the CFO, benefits are clear: automatically updated reports, less time lost in Excel, more control over data, consistently calculated indicators, quick visibility over risks, better discussions with management, fewer version errors, quick access to comparisons and trends, the ability to analyse, not just prepare data.
A CFO does not need only figures. They need confidence in figures. Automation creates this confidence through a repeatable and transparent process.
What the accountant gains
For the accountant, automation reduces operational pressure. They no longer need to manually prepare the same reports. They no longer search for data in multiple files. They no longer check fragile formulas. They no longer answer the same simple requests repeatedly.
Instead, they can validate exceptions, correct source data, track compliance and work more efficiently with management.
Automation does not eliminate the accountant's role. It makes them more valuable.
Common mistakes
- Starting with the dashboard, not with data.
- Not defining indicators.
- Using unverified data.
- Copying the Excel report exactly as it is without simplifying the process.
- Not involving the CFO and accounting in validation.
- Not treating security.
- Automating an unclear process.
- Not monitoring import errors.
- Not documenting formulas.
- Believing a beautiful dashboard guarantees correct data.
Conclusion
Financial report automation is not just a technical project. It is a step towards more mature financial management.
Excel remains useful, but it should not be the only base for recurring reporting. When data matters, when reports repeat and when decisions depend on figures, the company needs an automatic, verifiable and updated flow.
With Python, SQL and a well-built dashboard, data can be taken automatically, cleaned, calculated and displayed clearly. The CFO gains visibility, the accountant escapes repetitive work and management makes decisions faster.
You do not need to automate everything at once. Start with reports that consume the most time and indicators that matter most.
In the end, value is not in technology, but in the clarity it offers: correct, updated data available exactly when you need it.
Keep reading
- Why do my emails go to spam? Complete guide to SPF, DKIM, DMARC and server reputation
- How to build your own company email server with Mailcow, without monthly per-user subscriptions
- How to prepare your team for new software: training, adoption and resistance to change
- Qualified electronic signature in business applications: how to integrate it and what legal effect it has
Need guidance on a similar project or a technical audit?